Dashboards

Dashboards are primary bricks of a user interface. A set of navigable dashboards allows drilling down from top-level executive statistics to the detailed information on individual devices and services.
Grouped together, dashboards constitute UI of every AggreGate-based product. Custom solutions are also based on dashboards built during the system deployment phase.
The idea of dashboards is having all widgets constantly active and properly positioned when a system operator is on duty. Dashboards often open automatically once an operator logs in.
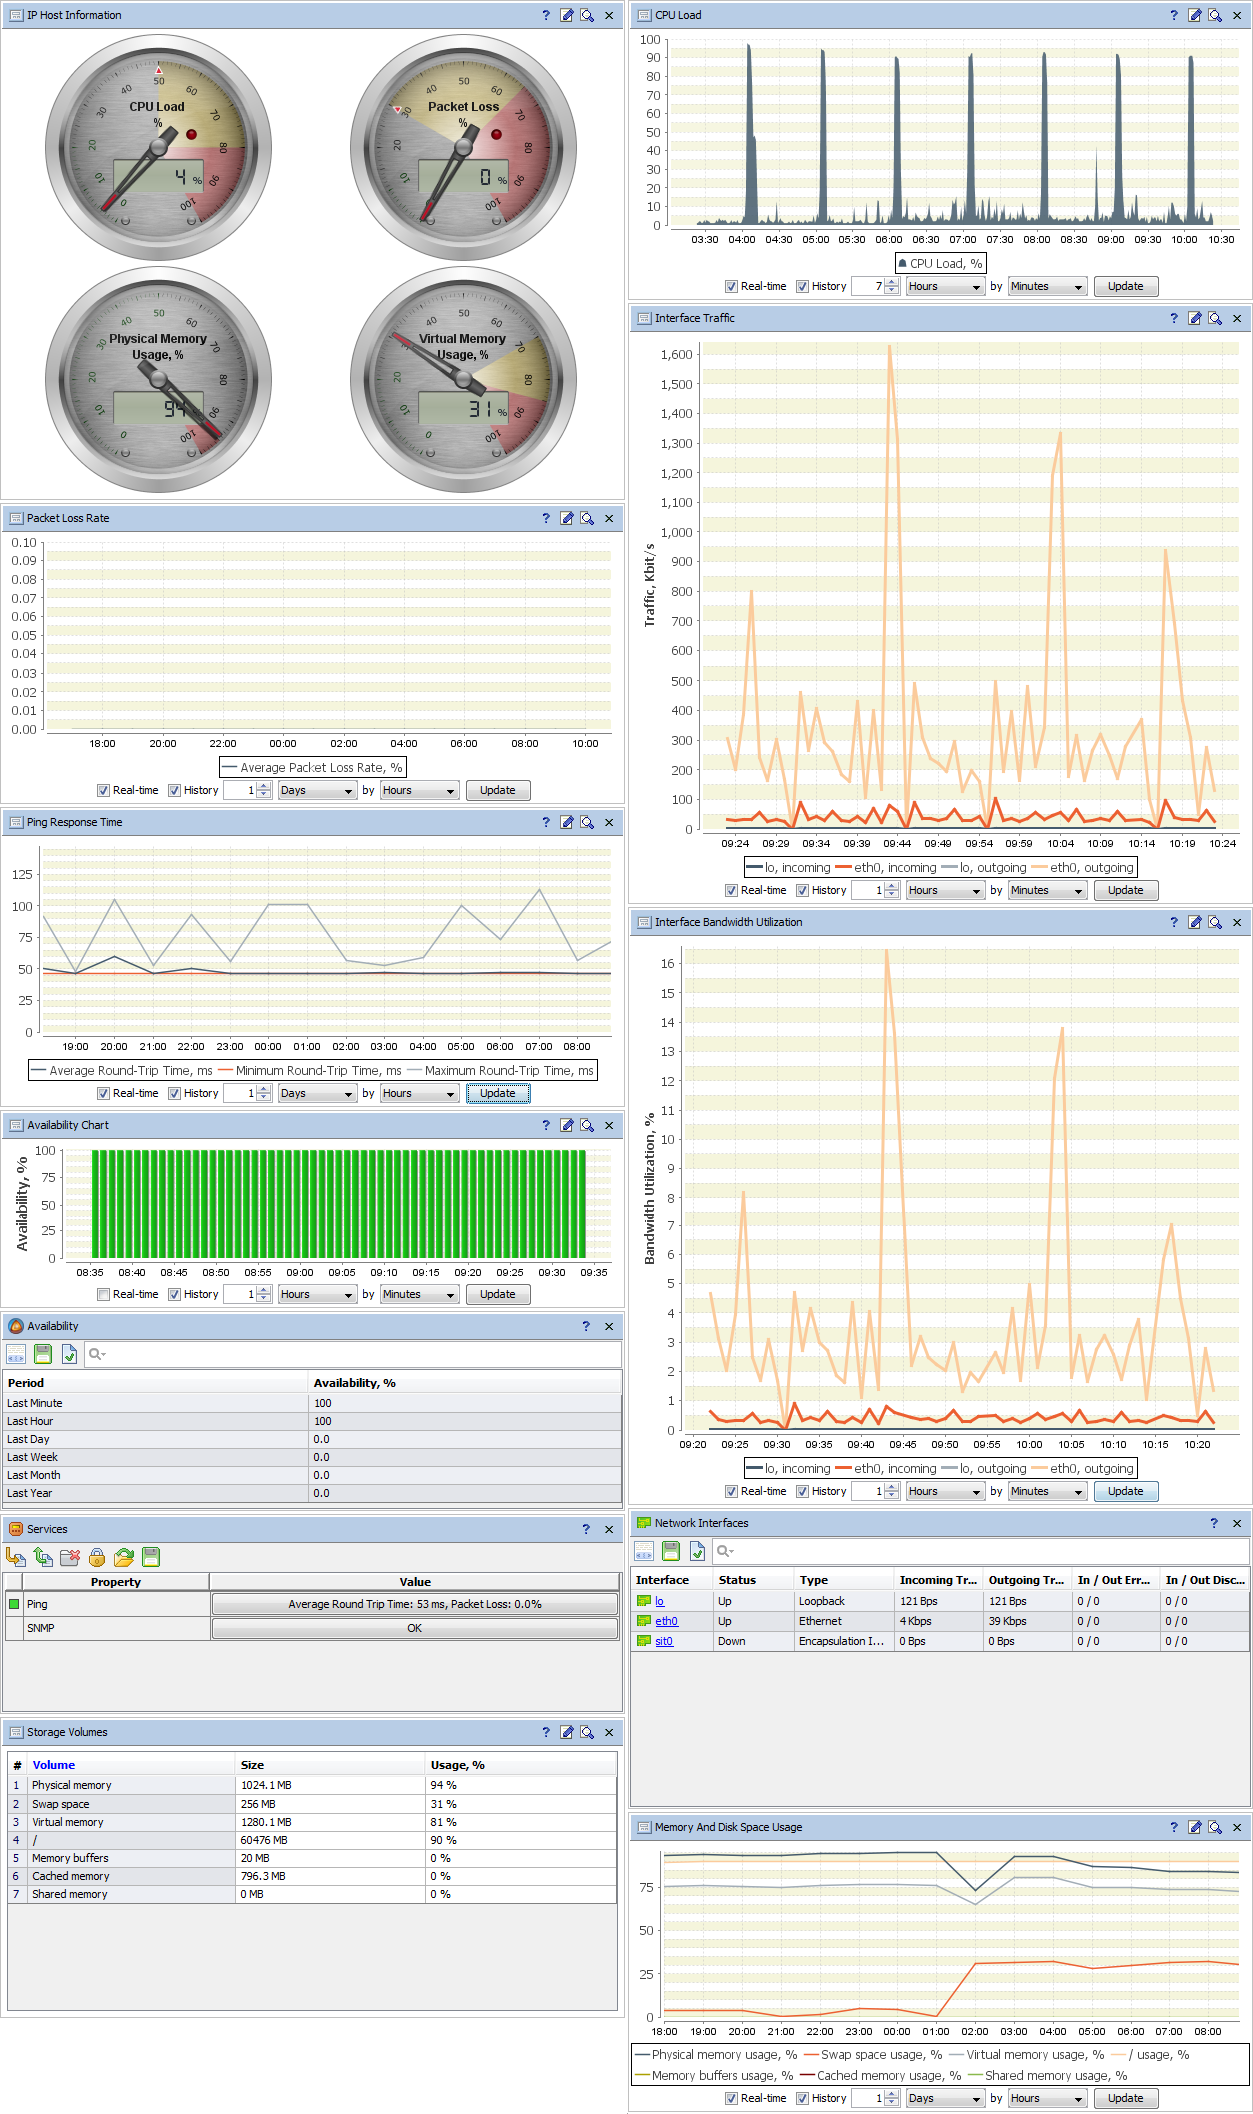
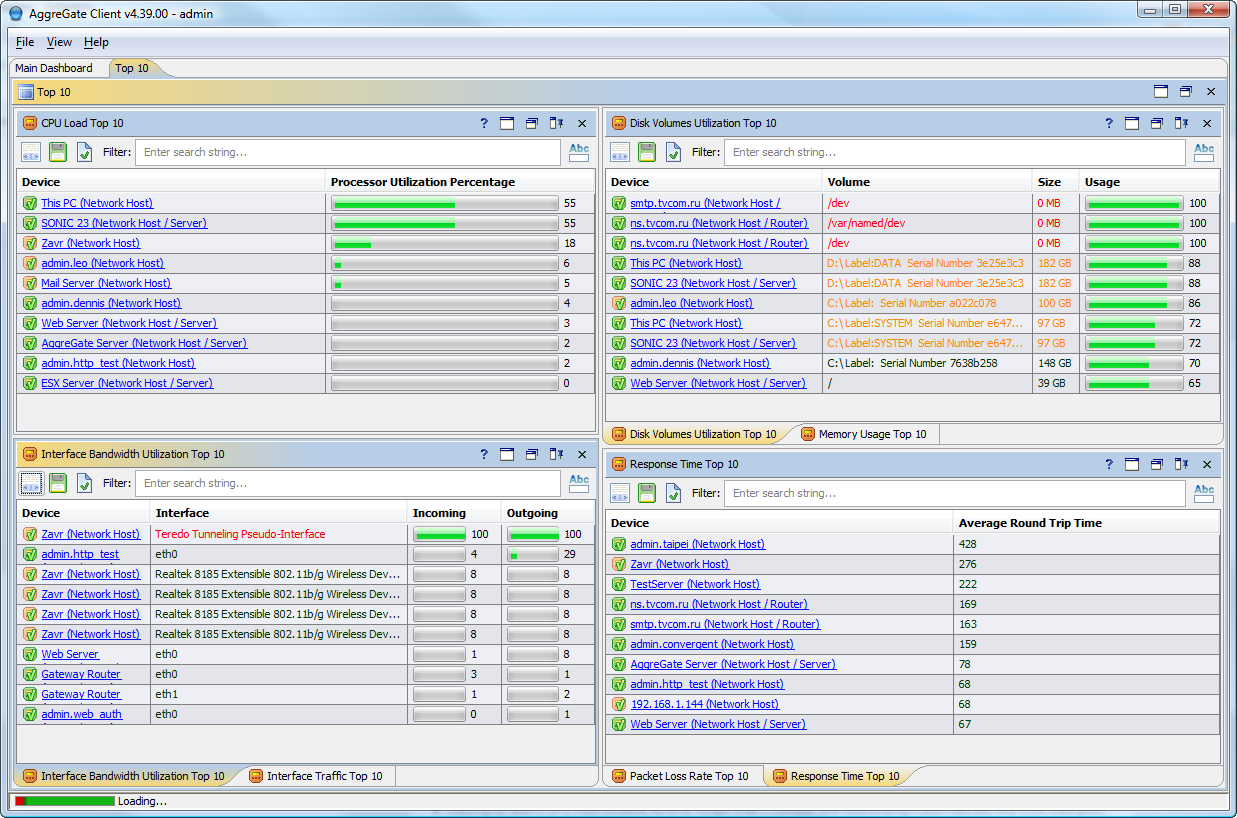
Unlike widgets, dashboards may contain tables, event logs, property grids, reports, system trees, and other elements. Widgets, in their turn, may include charts, maps, graphs, gauges, raster and vector images, video windows, and other UI components.
Dashboards are classified into:
- Overview dashboards (global)
- Asset-specific dashboards (per-device and per-resource)
There are two types of supported dashboard layouts:
- Dockable dashboards always fit to one screen, arranging windows into several tabbed panels attached to the top, bottom, left and right sides of the window
- Scrollable dashboards have multiple columns with vertically arranged windows
While vertical market products based on AggreGate include a lot of out-of-the-box dashboards, all those dashboards are fully customizable, and new ones can be created from scratch as well.