Virtual Infrastructure Monitoring
AggreGate Network Manager facilitates the consolidation, monitoring, automation, optimization and planning of your VMware-based virtual infrastructure.
Health and performance tracking is supported for:
| VMware vSphere |
| VMware ESX/ESXi and Microsoft Hyper-V hypervisors |
| Virtual machines (VMs) |
| Guest operating systems |
Since the Linux-based ESX server's operating system and Guest OSs act like conventional systems outside a virtualization environment, they can be monitored using the generic AggreGate tools.
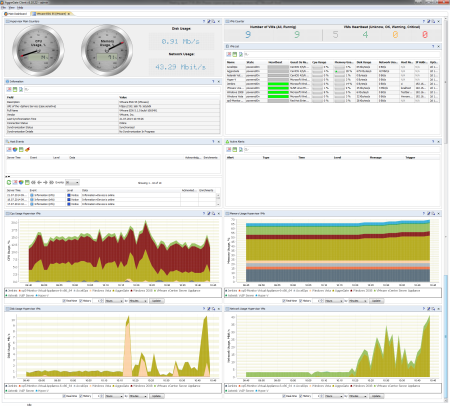
VM-specific information is handled by a set of dedicated alerts, charts and reports for the VM state change, high memory usage, undue CPU load and excessive disk I/O, along with the VMware Information widget, providing a consolidated view.
Virtual Machine Status Monitoring
AggreGate Network Manager auto-discovers the ESX servers in your network, retrieves characteristics of the existing VMs and applies the optimal monitoring parameters for them. Once the virtual machine monitoring is activated, AggreGate's pre-defined alerts notify a system administrator about the VM state changes, e.g. shutdowns or launches.
VM-specific details are available through the VMware Information widget and VMware Summary report:
| Virtual machine ID |
| Current status of the Virtual Machine |
| Guest operating system |
| State of the guest OS |
Virtual Machine Performance Monitoring
AggreGate Network Manager provides two VM performance measuring approaches: absolute utilization indicators and relative used/allocated ratio. Depending on a resource type, one of them or both are used for:
| CPU Load alert and chart |
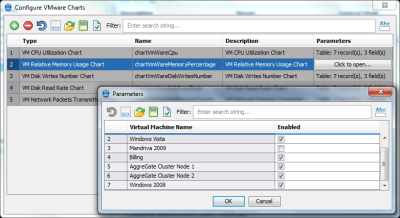
| Absolute and relative Memory Utilization alerts, charts and reports |
| Disk Read/Write Rate alerts and charts |
| Network Incoming/Outgoing Traffic charts |


